Transcript
Introduction
Let's talk Instagram Insights and how you can use them to grow your account.
Instagram Insights are a goldmine for your strategy, and you can learn so much from them. Using this little tab alone, you can understand what type of content performs best, what your audience engages with most, who your audience is, when they're most active, and so much more. So let's get right into it and walk through the Instagram Insights tab together.
An Introduction to Instagram Insights
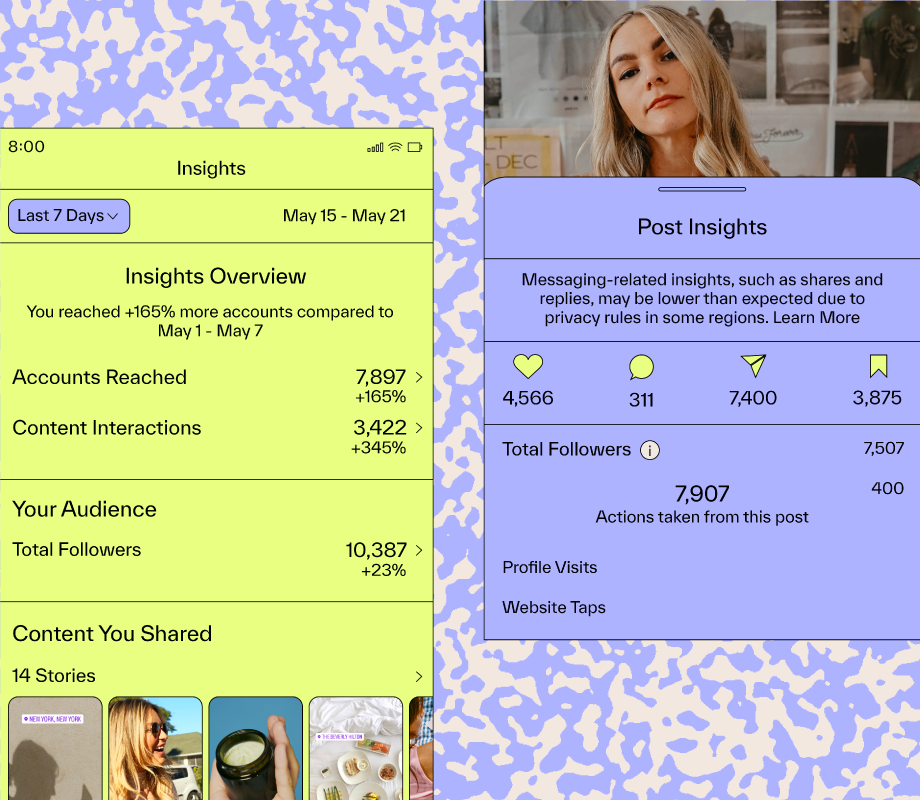
When you go into your Insights, you should see an overview like this. (The Instagram Insights page is shown.) If you aren't seeing this, it may be because you don't have a Creator or Business profile. To get the most out of Instagram's built-in analytics, we recommend switching to one of those account types.
Instagram automatically sets your Insights for the last seven days. If you press the button in the top left corner, you can change the duration. You can see analytics for up to 90 days, but for this, I'm going to set it to the last 30 days.
Now we can see our data from all of the content shared over the last month.
If you see a Plus sign with green, it means your numbers have gone up compared to the previous month.
And if you see gray with a Minus, it means they've gone down.
Right off the bat, this top-level information helps you understand how your account is performing. If you've gone down in "Accounts Reached", you can ask yourself, "What have I done differently this month compared to last?"
But again, this is only an overview. Let's go into each section and check out the individual metrics.
Instagram Insights - "Accounts Reached"
Let's start with "Accounts Reached". Here is where you'll learn all about who your content is reaching, which is so important when planning out your content strategy.
Instagram breaks this down into cities, countries, ages, and gender.
Instagram also breaks down how many followers and non-followers your content is reaching. This is so important. If one of your goals is to reach new audiences, you should pay close attention to this section.
Take a look at which content is reaching non-followers. If it's Reels, which it is for us, that's an indicator that you should keep sharing Reels.
You can get even more specific and find out which type of Reels are performing best. Go into the Content You Shared section, press into Reels and organize by Reach. Now you can see which of your Reels from the last 30 days reached the most people.
You can pull some great findings out of this. If your top-performing Reels are all educational videos, then you know to keep creating them. In this example, we're filtering by Reach, but if you press in the top left corner, you can filter by so many other metrics too. You can organize by most comments, Likes, Shares, Plays, Saves and interactions.
Instagram Insights - “Accounts Engaged”
Okay, we skipped ahead a little there, so let's go back to the Overview and we'll walk through the "Accounts Engaged" section. Here is where you can learn all about your engagement.
Again, remember to tap the last 30 days in the top left corner if you want to get the bigger picture. Right at the top here, you'll see the number of accounts engaged, and it'll give you a comparison to the previous 30 days.
"Accounts Engaged" is the number of accounts that have interacted with your content. This includes posts, ads, Stories, videos, Reels, and Live videos. As you scroll, you'll see more detailed information about your engaged audience.
Just like "Accounts Reached", you can see it split up by top cities, countries, age ranges, and gender. You'll also see a breakdown of followers and non-followers. As you keep scrolling, this is where the data gets a little juicy. It's split up into post interactions, Story interactions, Reels interactions, video interactions and Live video interactions.
Instagram Insights - Overall Interactions Breakdown
This main page has the Overall Interactions Breakdown so you can see how many Likes, comments, and saves you got across all of your posts for the last month. But if you press Top Posts, you can go in and see individual insights. You can segment your results by post type, metrics and date range.
For example, let's see which Carousel post had the most shares in the last 30 days. There you go. Now it pulls through everything. So simple, right?
Instagram Insights - Individual Post Insights
You can go back and follow the same steps to view individual insights for all your content types. If you want to see individual data on a post, tap into it and select View Insights. Here, you can see all the basics like your Likes, comments, Shares and Saves.
But then you can go even deeper. You can see your reach, impressions, engagement, interactions, and profile activity for each post. This data is so important for planning your strategy. If you're trying out new content types, this is where you really see how it performed.
Instagram Insights - Total Followers
The last section of the Insights tab is "Total Followers". Here is where you'll see all of the information about who actually follows you. The other is about accounts that engaged with you, which, as you know, can be non-followers, whereas this tab is all about your community.
Again, tap the top right corner to change your date range.
In this first graph, you can see how many followers you gained and lost over the last month, and you can actually tap the graph to see follower data for specific days. Next, you can see more info about your audience: top locations, age ranges, gender and last but not least, most active times and days.
Follower insights are so important. The best way to grow your following is by knowing and nurturing who already follows you. Plus, knowing when your audience is most active is so important for posting times.
Later’s Best Time to Post & Analytics Features
Instagram's Most Active Feature works, but if we're being honest (and maybe a little biased), Later's Best Time to Post feature is the best way to go. It automatically collects and tells you your Best Time to Post so you don't have to worry about it.
Later's Analytics feature has more than the Best Time to Post feature, which is pretty sweet if I do say so myself. It automatically calculates your engagement rate, gives you detailed analytics, ranks posts by engagement rates so you can see what's working (and what isn't), and so much more. And the best part is that the Analytics tool is free! I've included a sign-up link in the description.
And with that, you know everything there is to know about Instagram Analytics. We hope this was helpful. Let us know if you have any questions in the comments and we'll reply back to you. As always, don't forget to Like and Subscribe so you never miss a video. Thanks and I'll see you later.


