Facebook analytics is an incredibly effective resource for leveling-up your social media strategy and running successful marketing campaigns.
Of course, we always recommend our custom analytics tool available on Later Social's Scale plans - we did build it specifically for social media managers like you!
But, because Facebook Insights gives you such an amazing and diverse range of data to tap into, it's a great place to get started. We’re breaking it all down below in an easy-to-follow guide that explains each section of Insights.
Let’s get started!
Join over 1 million marketers to get social news, trends, and tips right to your inbox!
Email AddressSimilar to Instagram, Facebook’s built-in analytics (officially called Facebook Insights) is an extremely powerful tool!
With metrics like Page Views, Likes, Actions on Page, and more, it offers a ton of data-points that you can measure and leverage to improve your posting strategy.
But how is information useful?
While jumping into Facebook analytics may feel overwhelming at first, you might find some great nuggets of info that can inform your content and social strategy!
By tapping into metrics like your Audience Demographic, Post Views and Reach, and your Stories and Video performance, you’ll get an expert understanding of what’s working with your audience.
And more importantly, what’s not resonating with your audience and how to go from there. You’ll also be equipped to track your Page growth over time!
To get to your Facebook Insights page, you’ll want to go to your Facebook Page and find “Insights” in the top navigation bar:
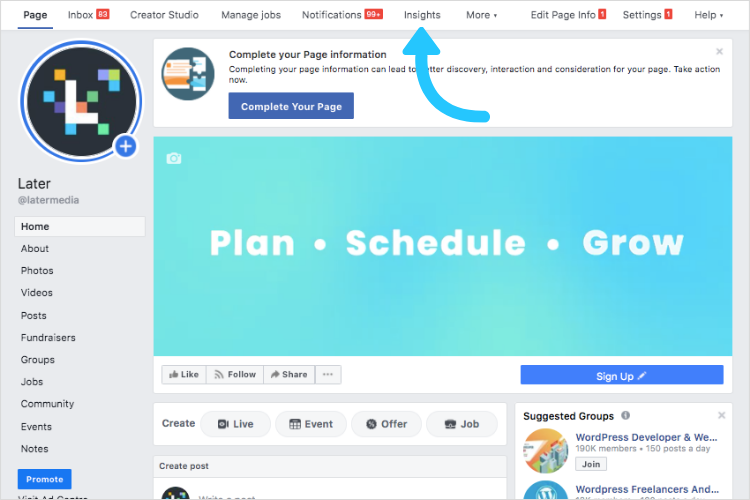
From here, you’ll find deep-dive section tabs on the left-hand side of the page. We’ll take each, in turn, to help you navigate through the complex (but very valuable!) information in your Facebook analytics.
If you’re looking to level up your Facebook strategy, you can plan, schedule, and post to Facebook with Later. Start your free trial today.
Facebook Analytics Explained #1: Find Your Page Summary in the Overview Tab
Once you click into the Insights dashboard, you’ll find the Overview section, as marked in the far left navigation column.
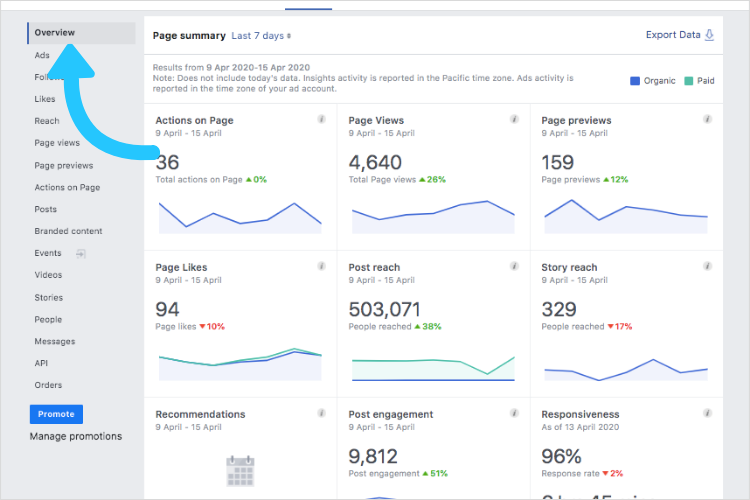
Right in step with its name, the Overview section gives you a wealth of information! Here’s how to start navigating:
#1: Page Summary
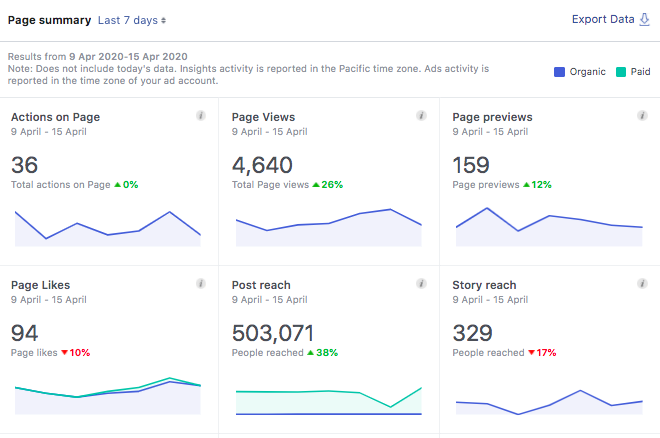
At the top, you’ll see the Page Summary section showcases a few standout metrics like Page Likes, Post Engagement, and Reach.
If you want to see your metrics across a different timeframe, you can easily adjust this next to Page Summary. Timeline options to adjust to include “Today”, “Yesterday”, “Last 7 Days”, or “Last 28 Days”!
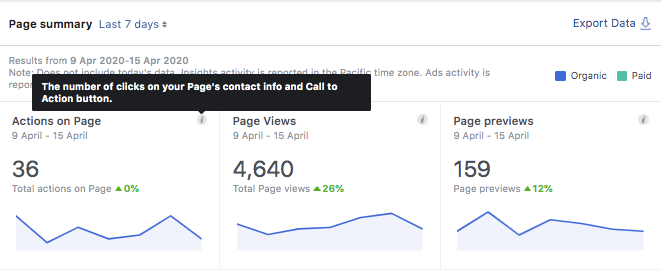
To learn what all the metrics mean, you can toggle over each section’s gray “i” for a short definition!
But, once you check out a metric and see what it means, how can you use it to your advantage?
There are tons of answers to this, depending on the goals you have for your Facebook Page, but here are few key tips:
If you’re focusing on boosting engagement: Check out your Post Engagement metric to assess where there were spikes! For each spike, go back and check out exactly what you posted that day — this will help you clue-in on the content that’s best engaging your audience. Post more of it!
If you’re posting videos that link to other webpages: The Videos metric can instantly show you how successfully you’re driving traffic via views and engagement. Investigate why some videos are getting clicked on more than others, and adjust your posting routine from there!
This is just a starting point, but you can deep dive into all the metrics to find out more about your page performance!
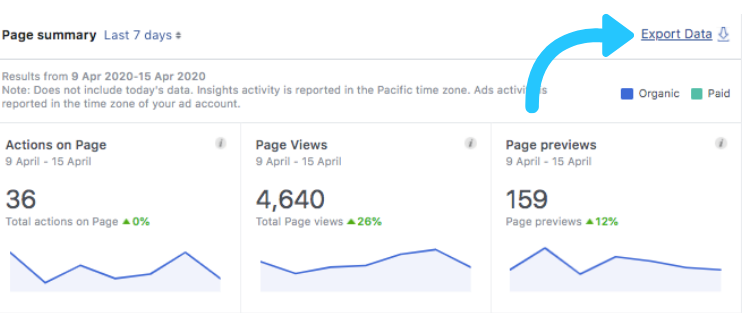
TIP: Use the “Export Data” tool in the upper left to export metrics around your Page, posts, or videos as CSV files or Excel spreadsheets! This is handy if you need to provide your team with reporting.
#2: Your Most Recent Posts
If you keep scrolling down the Overview tab page, you’ll see the next section labeled “Your 5 Most Recent Posts.”
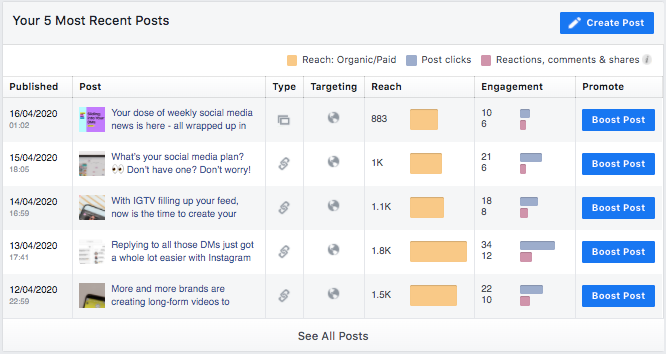
This convenient section provides quick insights on your last 5 posts, whether they were photos published, a status update, or a Facebook Stories post!
You can see the publish date/time, a link to the post, and the type, reach, engagement, and an option to promote.
This section is especially useful in assessing how you’re doing recently! Maybe you just did your first Facebook giveaway and published a handful of promotional posts — this section will tell you what you need to know to improve your next one!
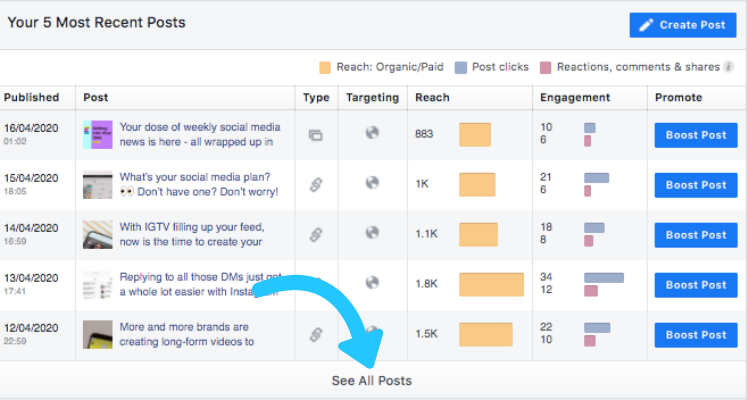
Outside of your 5 most-recent posts, you also have the option to go further back and take a look at all of your posts — just click “See All Posts”:
If you click the link to a post, you’ll find an in-depth performance overview including all reactions, comments, and shares on the original post and any shared instances.
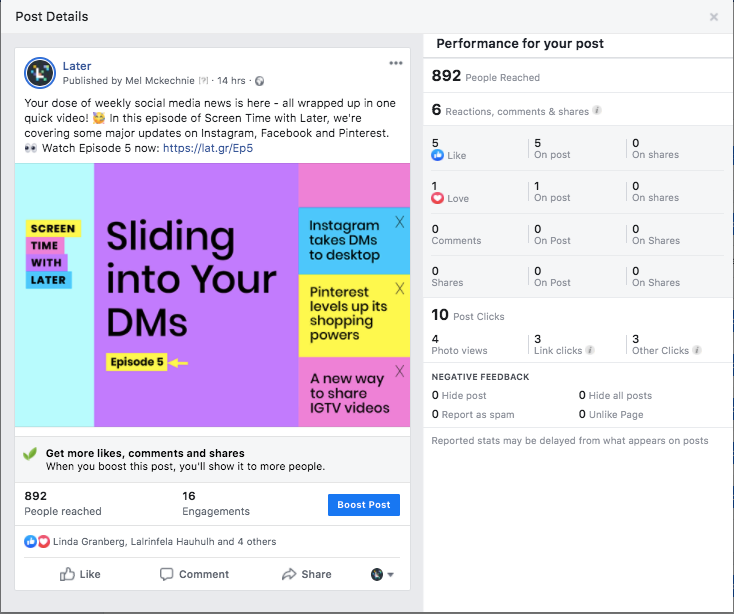
NOTE: Interactions that have been changed or deleted are counted toward the total. For example, when someone changes a reaction from love to like, it counts as two interactions!
#3: Pages to Watch
The last section of the Overview page is the Pages to Watch feature, a crowd favorite! This handy little section compiles a quick shortlist of a few other pages that are similar to your own.
It allows you to track the progress of 5 or more Pages you wish to watch, or save in this section to check up on later. Once you click “Watch Page”, you’ll see how many likes they get so you can keep up!

Here’s a few benefits of using this feature:
You can know how your Facebook Page is performing amongst peers and competitors
It’s a great source if you’re looking for content inspiration
You can use it to get a pulse on what’s trending in your line of business
If you click through on one of the Pages to Watch and scroll down, you’ll find their ranked top posts from the week!

Facebook Analytics Explained #2: Followers Insight
The Followers Insight is the next section of your Facebook Insights! To get to your Followers Insight, click the Followers tab in the far left navigation column.
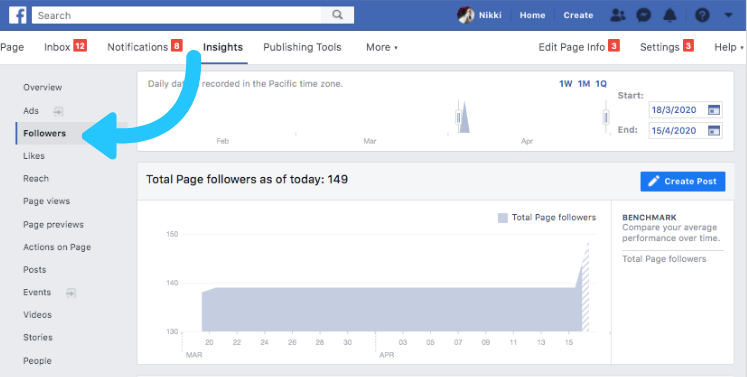
This section gives you 3 benchmarks: “Total Page Followers as of Today”, “Net Followers”, and “Where Your Page Follows Happen”.
Here’s a quick overview of each:
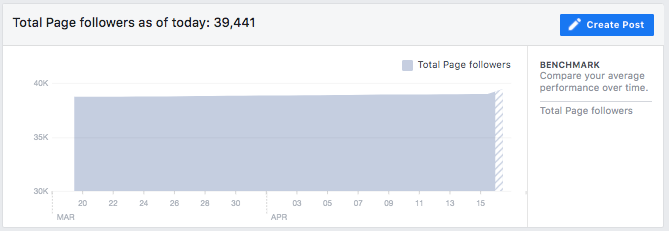
#1: Total Page Followers
This helps you compare your average performance over time! You can easily view which weeks you gained the most followers and find out why (i.e. see what you published those days or if you cross-promoted your Facebook page across other platforms).
#2: Net Followers
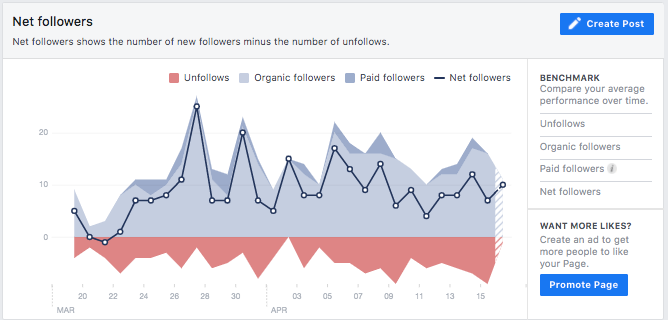
This shows the number of new followers minus the number of unfollows. In the left section under “Benchmark”, you can even select “Unfollows”, “Organic Follow”, or “Paid Followers” to segment and view specific data.
#3: Where Your Page Follows Happen
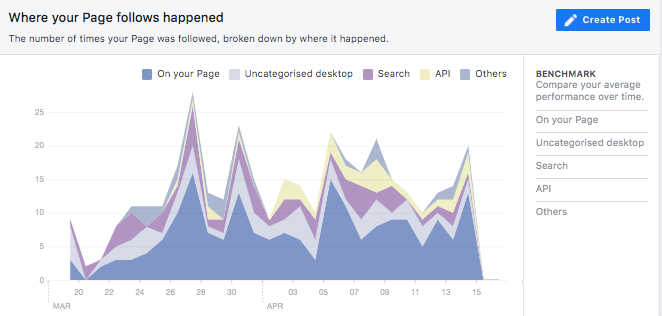
This shows the number of times your Page was followed, broken down by where it happened! You can segment by “On Your Page”, “Search”, or “Uncategorized Desktop” to check out followers gained from those sources.
If you see that a lot of your follows come from “Search”, it’s a smart idea to boost the SEO of your Facebook page to become even more discoverable!
Your Follower Insights give you access to a wealth of information on your page performance and when people have decided to press that “follow” button.
It’s worth spending some time analyzing all the info in there to build out your content plan if your goal is to grow your followers.
Facebook Analytics Explained #3: Likes Insight
Next up is the Likes section! However, don’t be fooled by its name — this section dives into so much more than your Likes count.
It actually does a great job of showing you growth, averages, and where the Likes came from so you can better target your audience.
First, set the date range at the top and then dive into the 3 different graphs:
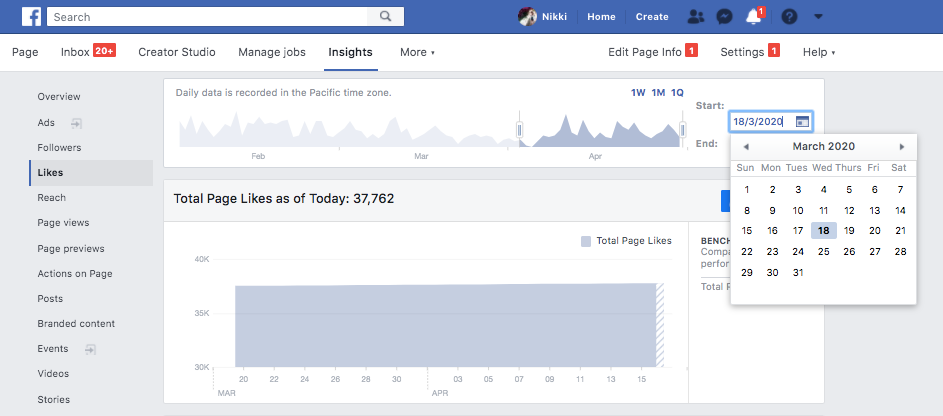
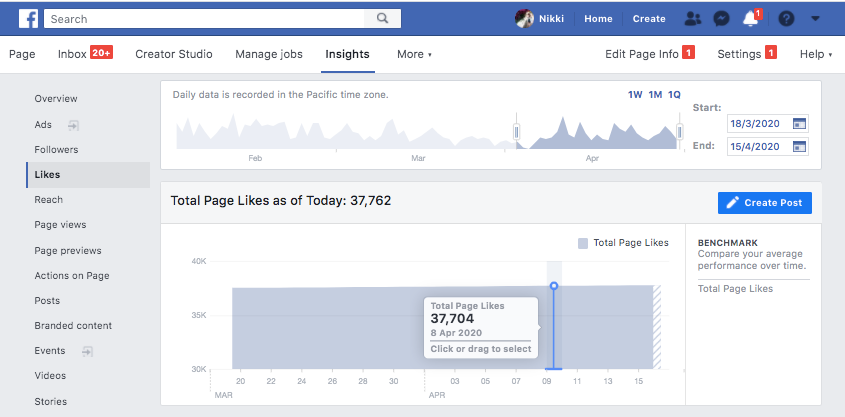
#1: Total Page Likes as of Today
This data is neatly displayed to give you a big-picture view of your Page Likes. For example, if you see a bit of a decrease in the graph, make an effort to find out why!
Maybe you stopped posting as much? Take that as a sign to pick up the cadence!
#2: Page Likes
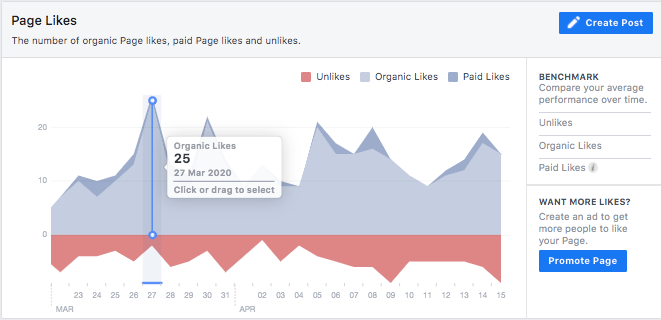
Here, you can break down the “Total Pages Likes as of Today” even more. Use Page Likes to segment and see the number of organic Page likes, paid Page likes, and unlikes!
#3: Where Your Page Likes Happened
Similar to “Where Your Page Follows Happened”, this section shows you the number of times your Page was liked, broken down by where it happened (i.e. Likes from your Page, from search, or from elsewhere).
If you’re seeing a lower number of Likes from your Page, try leveling-up the visual appearance of your Page or sprinkling in call-to-actions across content like, “Be sure to Like our Facebook Page to stay up-to-date on the latest!”.

Facebook Analytics Explained #4: Reach Insight
If you’re looking to give your content longer legs, this is the place to be! Here you’ll find data around Post Reach, Recommendations, Likes, Comments, Shares, and more.
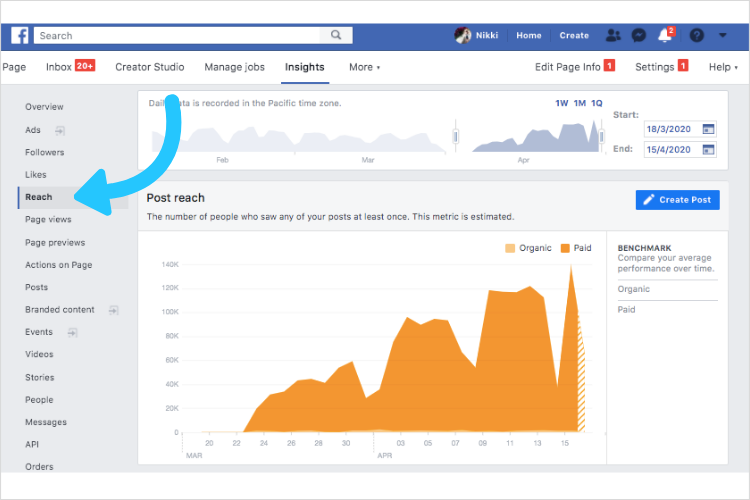
If you’re not too familiar with the term, the simplest way to understand reach is to think about it as the number of people who saw your post at least once.
Reach is a powerful insight to check up on. By keeping tabs on your overall reach, you get a quick-glance understanding of your organic reach over time and if your campaigns are working.
The reach graph here shows how many people saw your post organically, or through search (you can segment!).
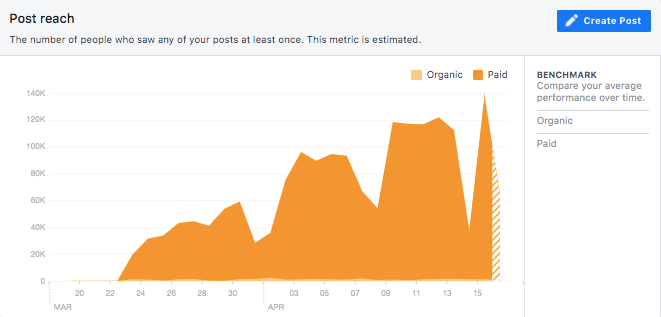
You can also see your Facebook Stories Reach metric on your page, which can give you an idea of just how many people have tapped through your Stories posts!
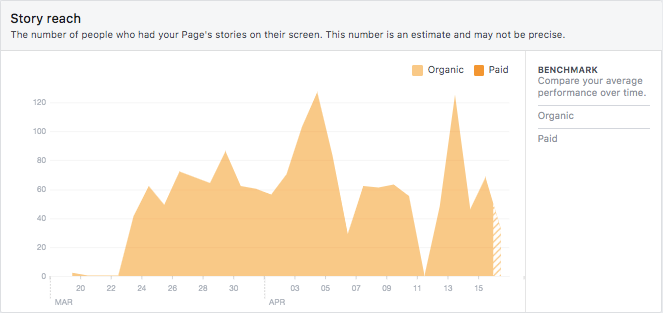
PRO TIP: Set your date range for one week and get your average metric. You can do this with a different week, or a few, and then compare all the averages to get a week-over-week understanding!
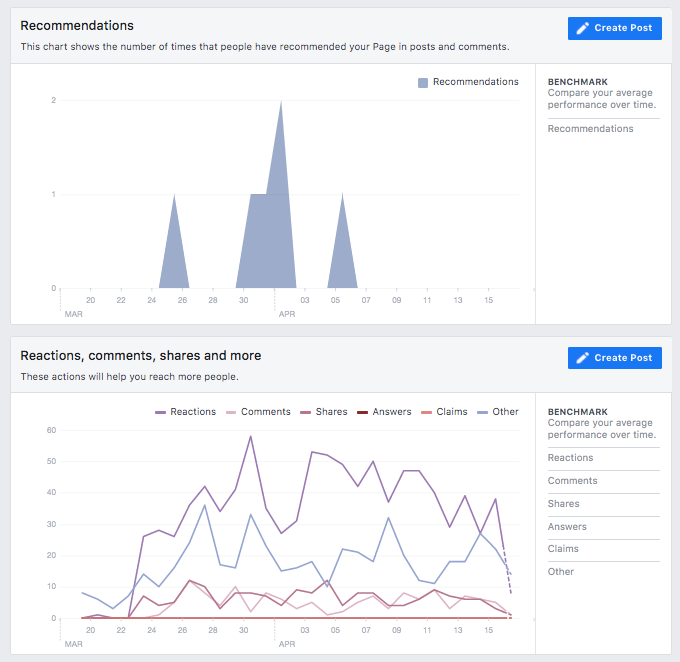
If you keep scrolling you’ll see graphs for Recommendations, Likes, Comments, and Shares. These graphs help you understand the actions people took after they saw your post. In other words, these “actions” are factors that helped increase or decrease your overall reach.
These actions, then compiled, equals your engagement!
Facebook, like its counterpart Instagram, runs on algorithms!
Think of it this way: The more engagement your post gets, the more likely Facebook is to place it in front of other users (via the “Sponsored” section if you’re doing paid advertising, your “Explore” page, and other places) to boost its discoverability.
This boost in discoverability = a boost in reach!
If you scroll down, you’ll see a “Hide, Report as Spam, and Unlikes” section next.
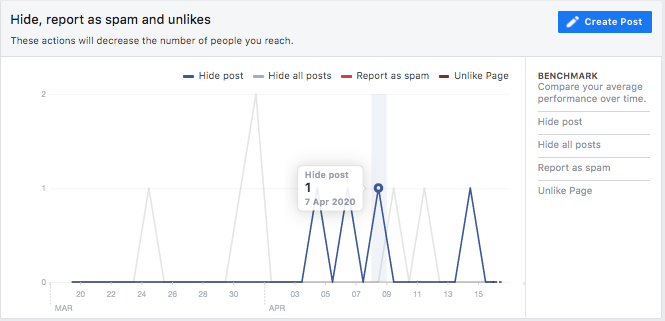
Consequently, when a Facebook user takes one of these actions on your post, it tells Facebook to decrease the number of people your post reaches.
These actions are negative, and you want to keep the data here low and as close to zero as you can. If you see a spike in this graph for a specific post, take it as a red flag — check out the post to see why it may be receiving negative feedback, and consider adjusting it!
The last area under the Reach tab is Total Reach.
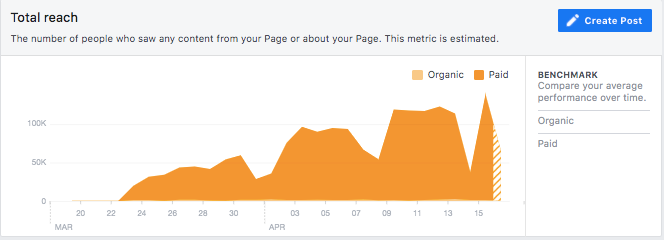
Total Reach is the number of people who saw any content from your Page or about your Page. This can include your posts, posts to your Page, ads, mentions, check-ins, Stories, and more.
This is a wonderful feature to tap into to understand how your reach has been growing.
PRO TIP: Total reach allows you to view data in table format if you’d prefer. Simply click a data point and a table will pop up!
Facebook Analytics Explained #5: Page Views Insight
The Page Views tab shows you who viewed which sections of your Page.
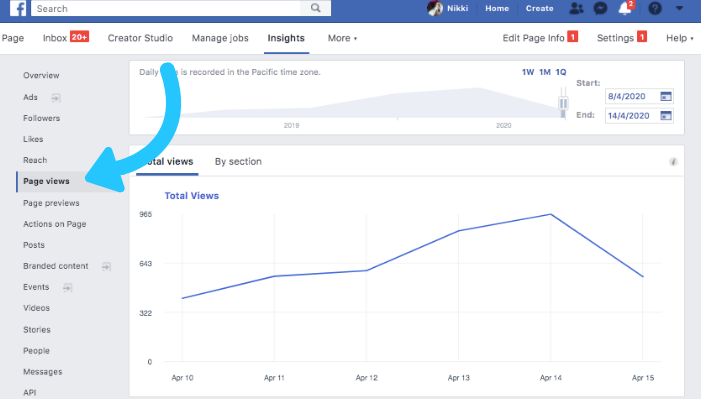
If you’re familiar with Google Analytics, the Page Views tab is similar! It dives into high-traffic sources, where visitors came from, and what they did after they landed on your Page.
It’s also very telling in terms of demographics, as you can check out traffic demographics like gender, age, and city, to name a few.
The different data sections for Page Views are “Total Views”, “Total People Who Viewed”, and “Top Sources”.
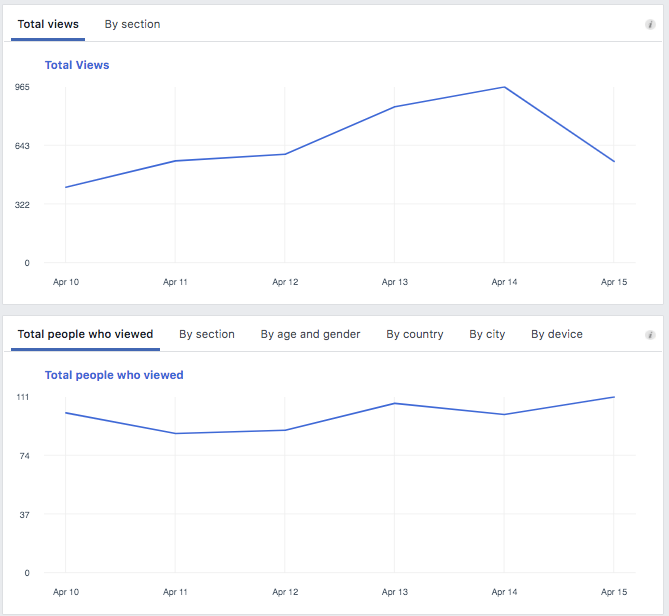
Total Views are the number of times your Page’s profile has been viewed by logged in and logged out people.
You can break your total views down by section to see which area of your Page visitors checked out — like your Homepage, Posts, About page, or Community page.
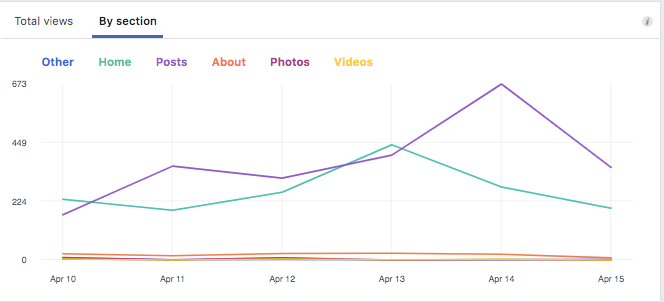
Total People Who Viewed represents the number of people logged in to Facebook who have viewed your Page’s profile. This is where you get that awesome demographic info!
Toggle between the age and gender, by country, by city, and by device options to get a comprehensive understanding of your visitors’ characteristics:
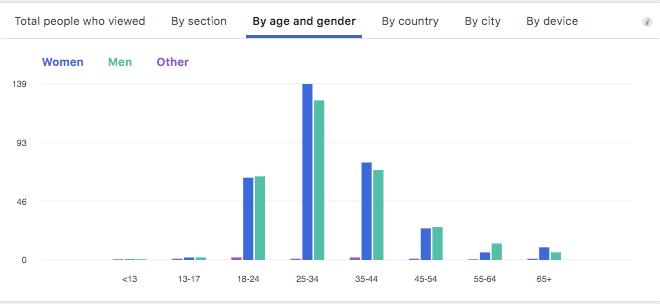
TIP: If you see a ton of your visitors are checking out your Page’s profile on mobile, perhaps format your Posts to be vertical and mobile-friendly!
Last up is Top Sources. The section gives you the scoop on where your Page visitors are coming from, which is really good to know for cross-promotional purposes! You can also discover where else your Facebook may live or appear on the internet.
The graph for Top Sources shows the top 5 sources that drove people to your Page and when, as marked by date. You’ll see that these sources might be Instagram, Google, or your brand’s website!
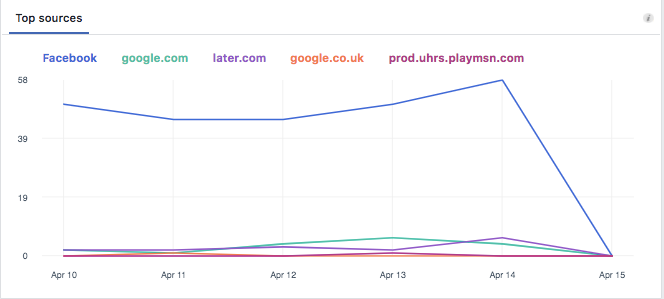
If one of your goals is to drive people from your website to Facebook (or from anywhere), this is the place to go to track your progress as you experiment and make improvements.
Knowing your top 5 traffic sources also allows you to boost your efforts on those sources. Boosting effort on data-proven sources = more traffic in the future!
Facebook Analytics Explained #6: Page Previews Insight
Page previews are the number of times someone hovers over your Page name or profile picture in News Feed and in other places for more information without actually clicking your Page.
Facebook breaks this Insight down into 2 graphs — Total Page Previews and Total People Who Previewed.
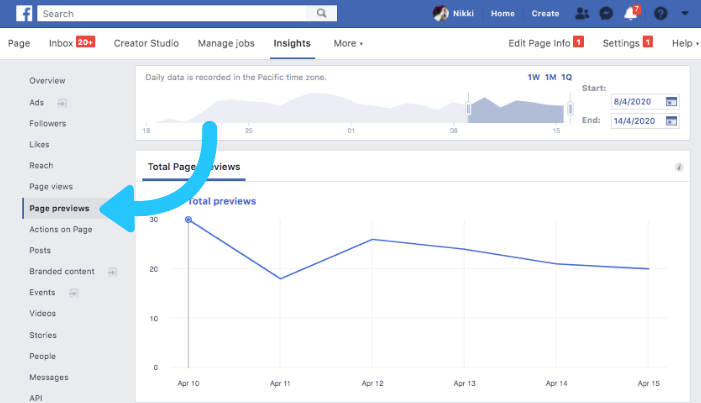
These 2 metrics are a representation of your reach as well and are a good way to gauge how interested people are in your Page. Think about it like this, if someone hovers over your Page to preview it, that means they were curious enough to check it out!
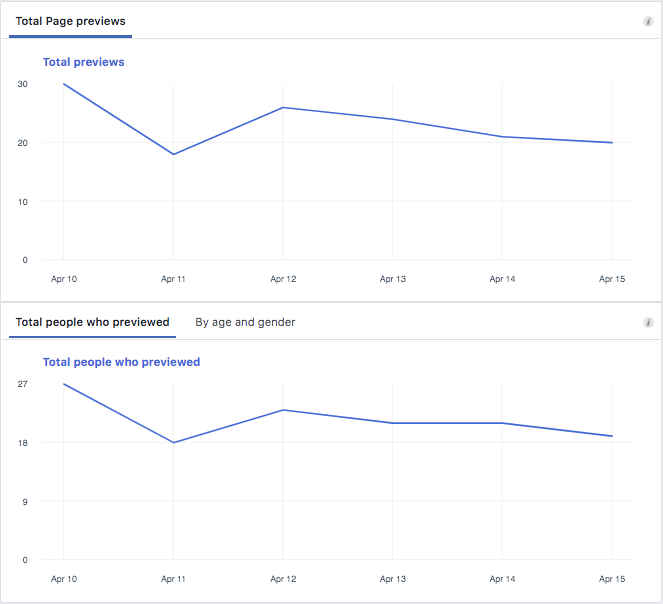
Demographics like age and gender information are available for total people.
Facebook Analytics Explained #7: Actions on Page Insight
This tab helps you understand what people do once they’ve landed on your Page. All set against a timeline, there are a few different metrics here, including how many Facebook users clicked on your “Get Directions”, your website, your phone number, or your action button.
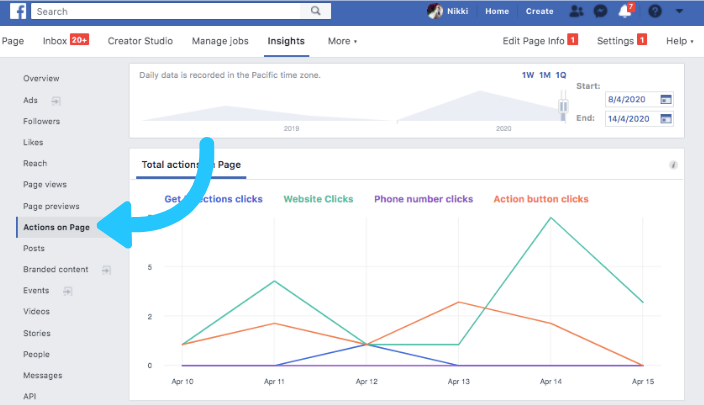
If you scroll down there’s graphs for each of these 4 metrics that dive into the demographics, as shown by the “People Who Clicked”.
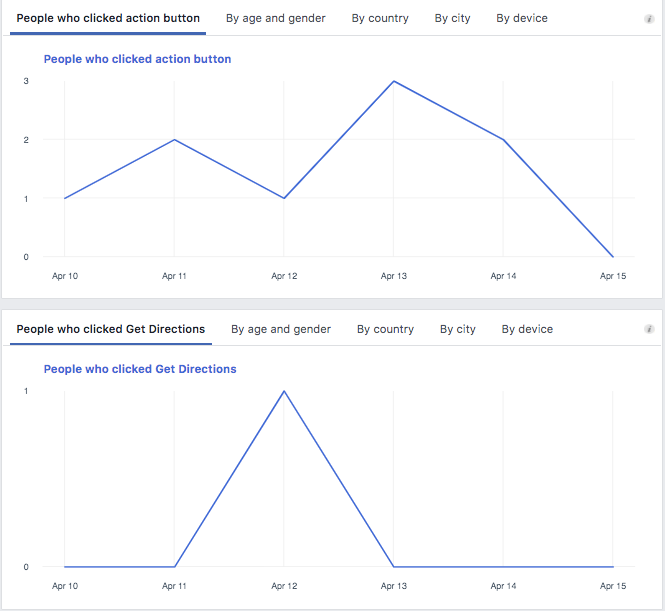
PRO TIP: Think strategically about what kind of business you are and how you should value different “Actions on Page” metrics.
If you’re a local business, for example, you may take a high number of “Get Directions” and phone number clicks as a win. If you’re online-only, you may interpret the sheer number of people who clicked on posts as a win.
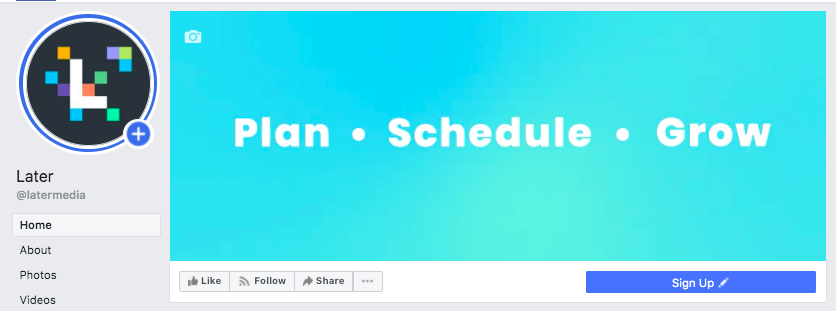
As for the action button, you can customize it! For example, you can make your action button a “Sign Up” if you offer some type of membership or subscription.
This is the tab to visit to nail your posting strategy!
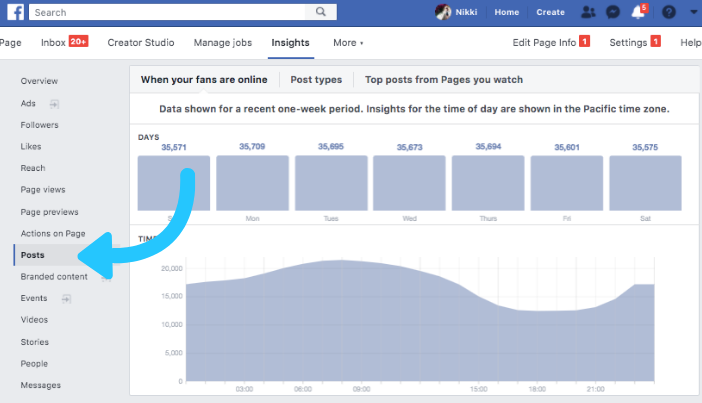
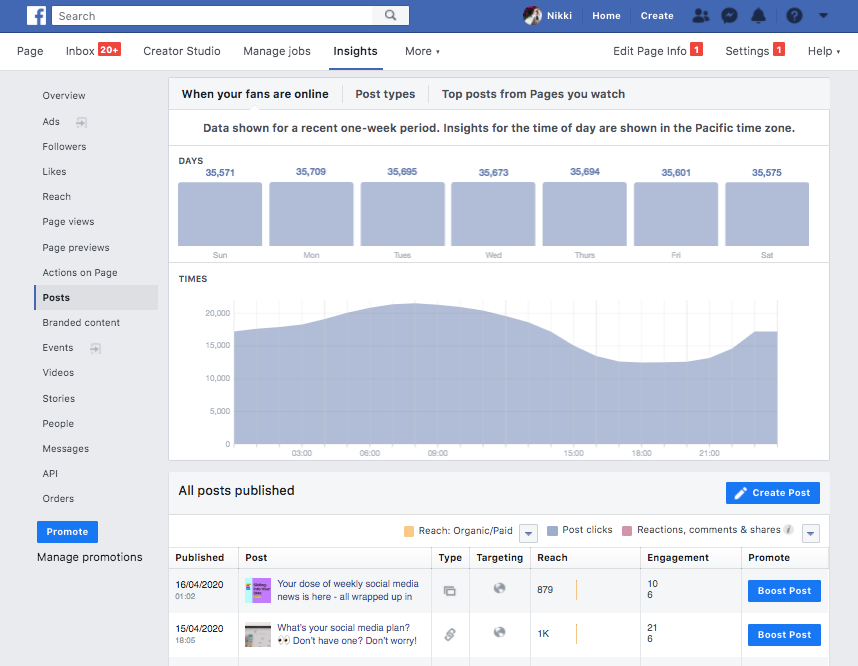
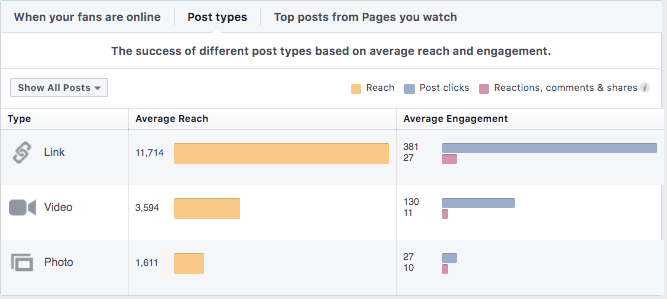
The Posts Insight tab shows you:
#1: The top days and times of the week your audience is online.
This tells you your best times to post — post when traffic is high!
#2: A breakdown of your post types and how they did in terms of engagement.
This tells you what types of posts you should continue focusing on.
#3: The top posts from the Pages you watch
This is great for industry insights and inspiration, and for identifying new trends!
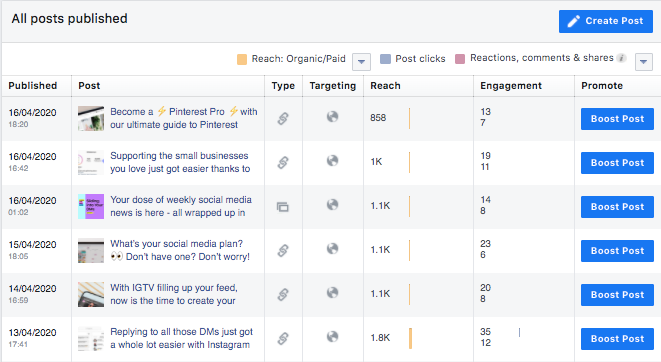
#4: All posts published
It lists out all the posts you have published on your Page, plus info like date and time, post caption, post type, targeting, reach, and engagement.
Don’t forget! You can automatically publish to Facebook with Later. Start your free trial today.
Facebook Analytics Explained #9: Events Insight
The Events tab sheds light on how successful your Event Pages are! Here, you can manage and track the performance of all your events in one place.
If you’ve ever organized events on Facebook, you should be checking this tab routinely.
A few benefits to the Events Insight:
You’ll get insights driven by data that will help you improve your next event
You can see how your promotion strategy is working
You can see how many people saw your event, plus their demographics
You get visibility to things like ticket sales, ticket clicks, and signups
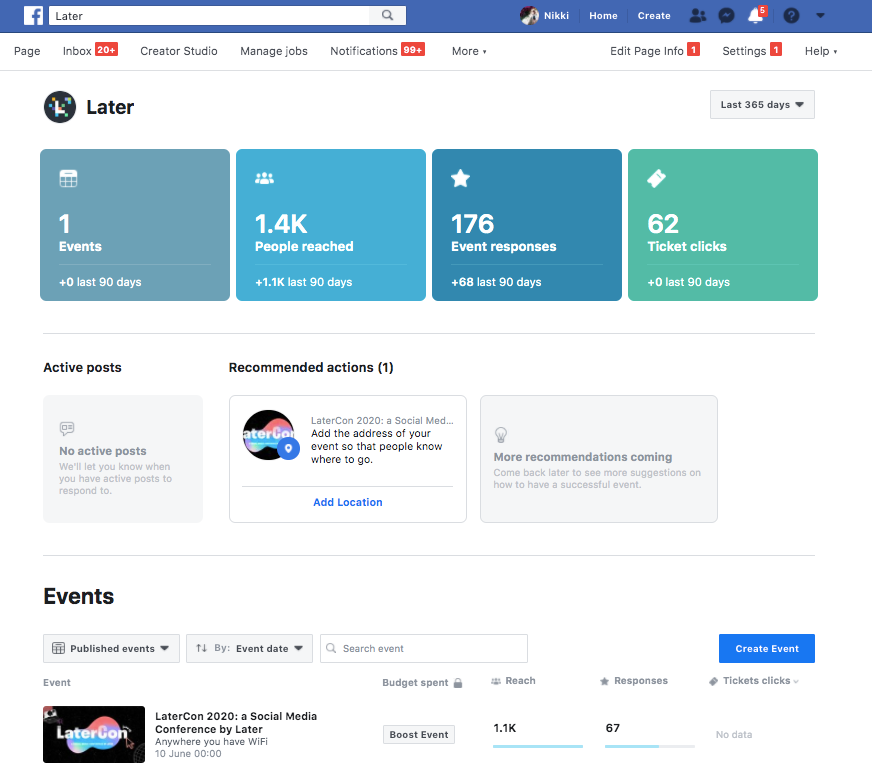
The Events Insights tabs recently had a revamp and now has its own dedicated dashboard.
From here, you can get a snapshot of your event’s performance, whether that’s just one event or multiple!
Then you can investigate finer details of each of your live and past events like:
Awareness
People reached
Event page views
Engagement
People who responded
Event actions
Tickets
Clicks on buy tickets
You’ll also see an Active Posts section, where you can view and respond to posts from guests across all of your events!
There is also a “Recommended Actions Section” where Facebook will recommend actions you can take to make your events more successful.

You can also categorize by upcoming and past events. Simply toggle between the 2 options to see what you’ve already done and what you have coming up. This feature serves as an easy, automatic event audit!
Facebook Analytics Explained #10: Stories Insight
Check in on how your Stories are doing with your fans/ followers! The Stories tab shows you stats on how your Page’s recent stories have performed. Stories will still disappear from your Page after 24 hours but remain visible here for 28 days.
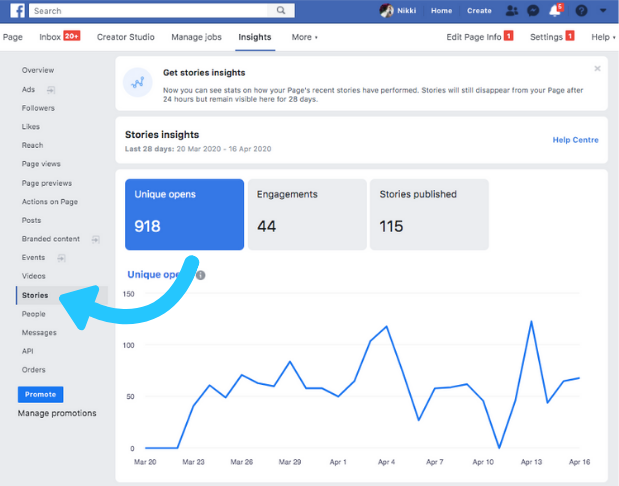
For metrics, you’ll find out how many unique opens you got on your Stories within the 28-day window, how many engagements you got (like swipe-ups or comments), and how many Stories you’ve published.
If you see a spike in Unique opens, see what day of the week/time you posted your story — this may be a strategically smart time for you to repeat!
If you have a large audience, Stories data here also dives into the demographics of the audience who’s viewing your Stories.
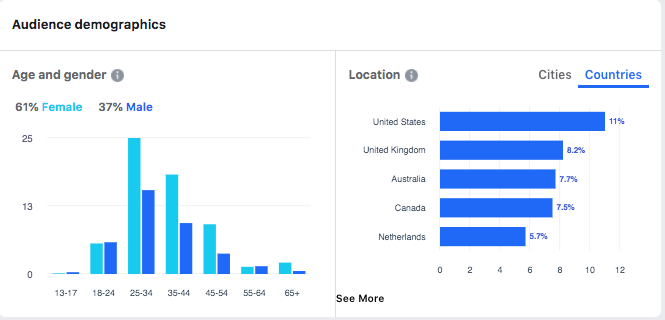
This information is good to have on hand because it guides you on future content you should create that will resonate well with your engaged audience members!


